Using an external service
We’ll continue with the development cycle, this time adding an external service to the project. The example we’ll use is just a simple one: setting up logging with LogDNA. All the same, it demonstrates some key aspects of configuring external services - you will most likely need to:
- install some additional software specific to that service and the interfaces it provides
- obtain some sort of key to authenticate with the external service
- configure your settings appropriately
Explore your project’s logs
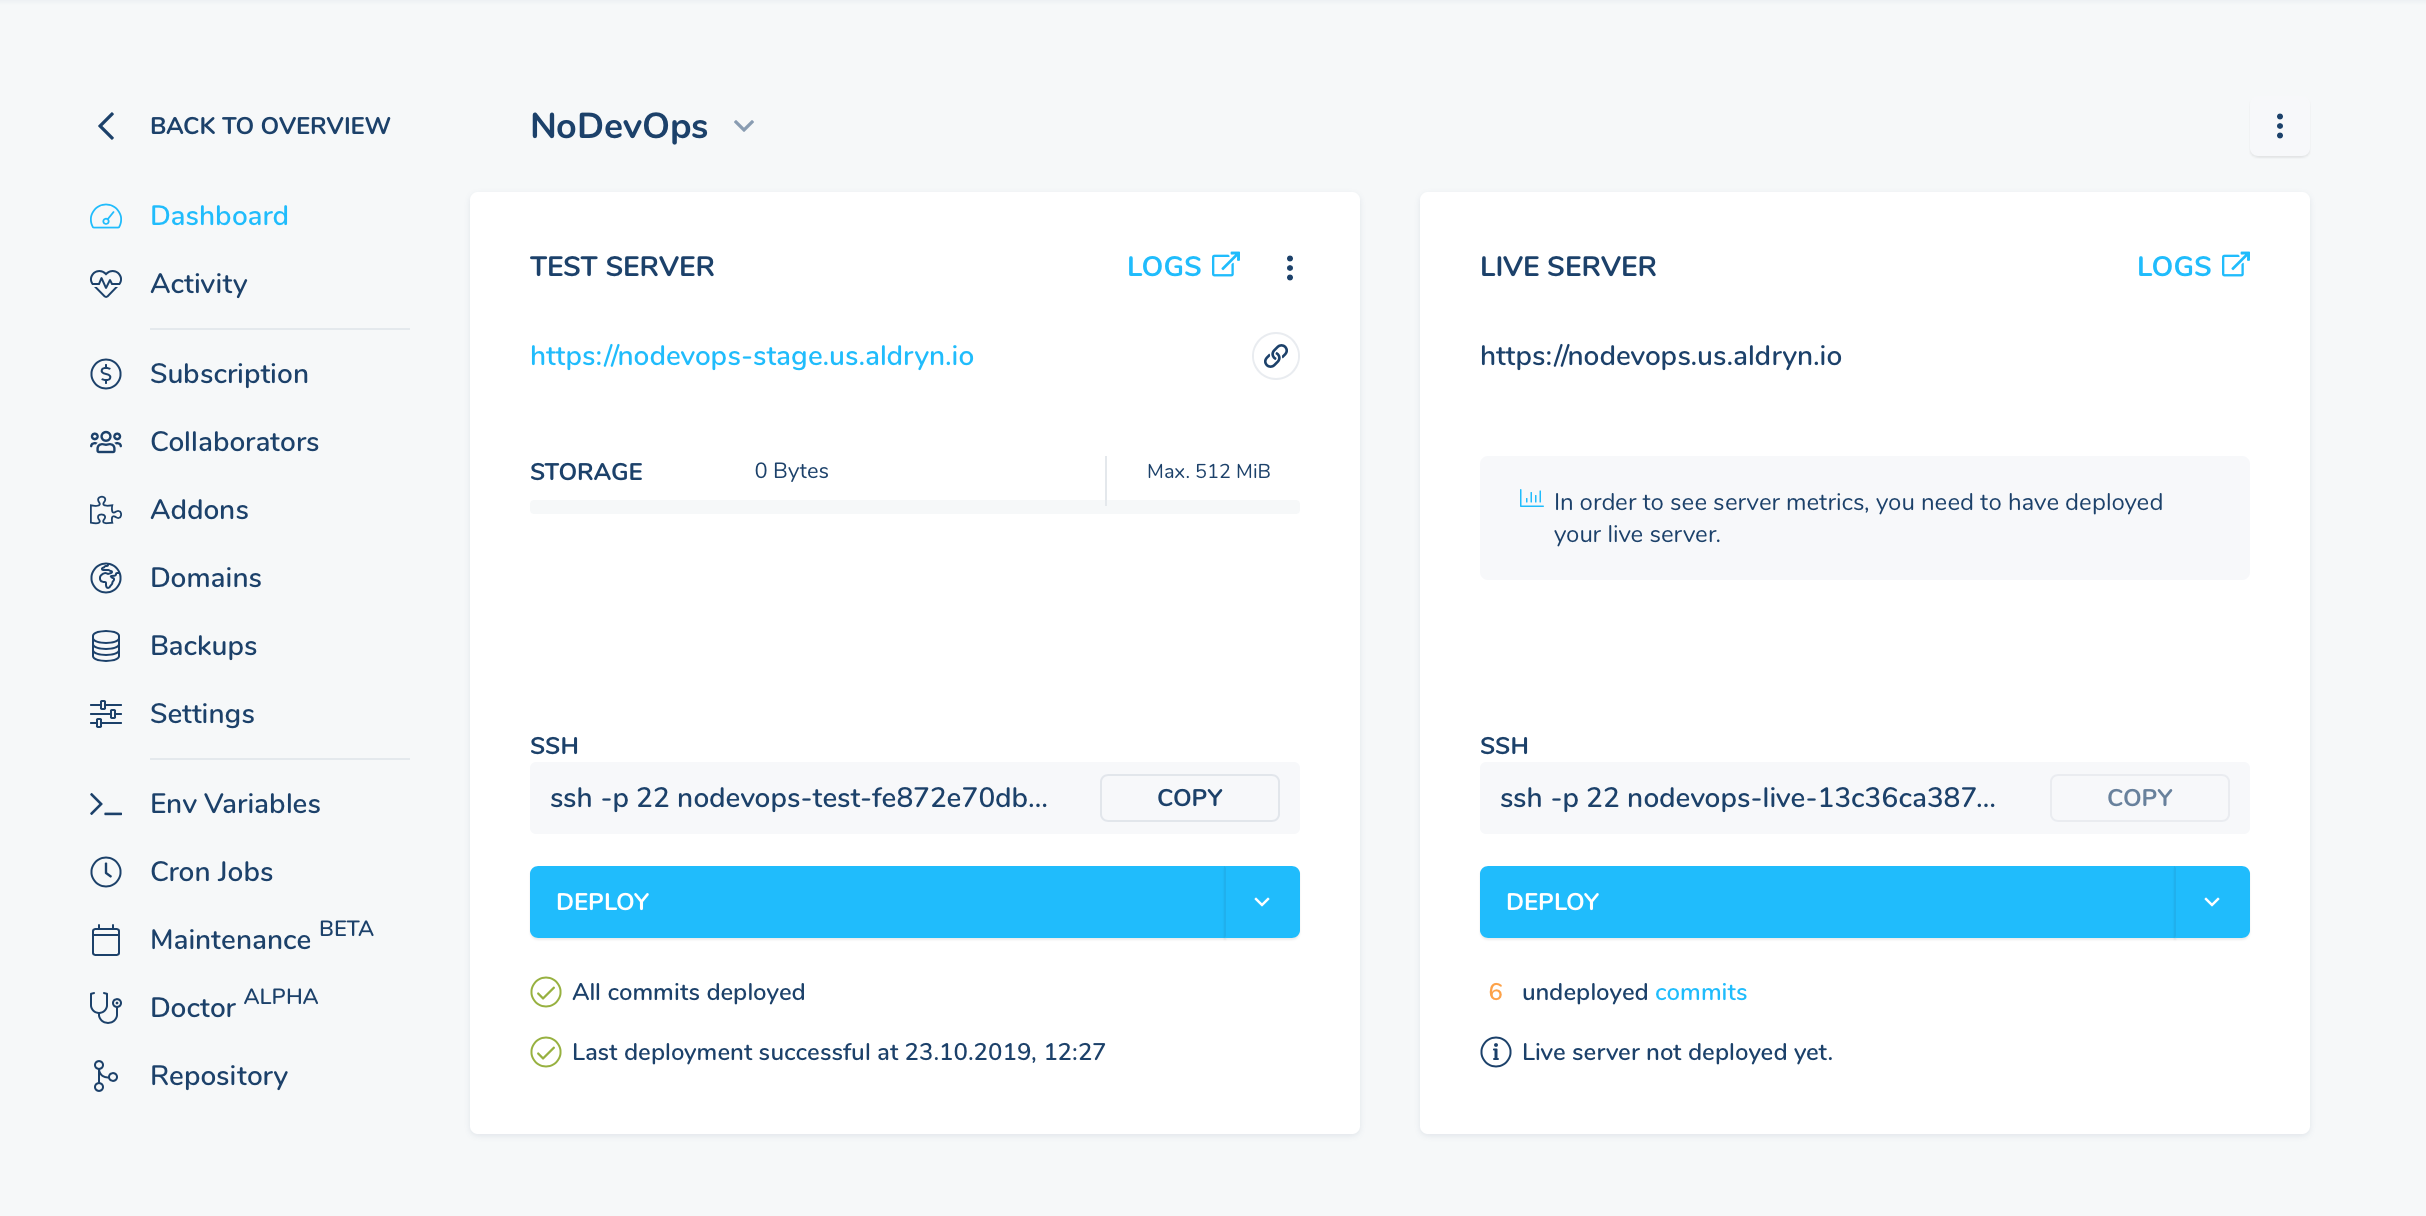
Your project emits logs. You can see them in the console when running locally. In addition, you can use the Logs link on the cloud server to see logs from the Test and Live environments.
The cloud server logs
These logs have some limitations.
- they are limited to 1000 lines
- they are undifferentiated (everything appears in one place)
- they do not update in real time
They’re adequate for basic purposes, but not really sophisticated enough for use in production for a complex, high-traffic project.
Server logs from a shell session
Perhaps you are used to SSHing into a server to run tail on a log file. This is quick and convenient, and perhaps
you’d like to do this with your containerised project. However, it’s not going to work well in a containerised
environment. When your project is running inside a container, you won’t have the same kind of access. For example,
you can’t rely on being able to SSH into it in the usual way., and your project may not even have a
persistent filesystem that it can save its logs to.
You can try it if you like, if your project has SSH access enabled:
- but you will soon find that the results are not satisfactory.
Configure logging as an external service
Subscribe to the service
If you don’t already have a LogDNA account, visit https://logdna.com and register for a free account. LogDNA will provide you with an ingestion key.
Install the logdna package
The logdna package provides a new logging handler (logdna.LogDNAHandler) that will forward log messages to
LogDNA.
Add logdna to your project’s requirements and rebuild the project (docker-compose build).
Configure logging in settings.py
It’s beyond the scope of this document to go into details of logging configuration in Django. In summary, however:
- the Aldryn Django project you’re using a default logging configuration already
- this makes the
LOGGINGdictionary available insettings.py - we will extend that, by adding a new logger and handler configuration.
The LogDNA library provides a logging handler, via the class logdna.LogDNAHandler. Add the new configuation to the
end of your settings.py:
LOGGING["handlers"]["logdna"] = {
        'class': 'logdna.LogDNAHandler',
        'key': '<insert your ingestion key here>',
        'options': {
            'hostname': 'your-website-name',
            'index_meta': True
        }
    }
What we have done here is added the new handler, logdna (the name doesn’t actually matter) as a key to the dictionary.
Next, we need to configure the existing loggers, that actually produce the logs, to use the handler. In this example, we will append the logdna hander to the configuration of:
- the unnamed root logger
"" - the
djangologger - the
django.requestlogger
LOGGING["loggers"][""]['handlers'].append('logdna')
LOGGING["loggers"]["django"]['handlers'].append('logdna')
LOGGING["loggers"]["django.request"]['handlers'].append('logdna')
More information about configuring Django logging can be found in Django’s logging documentation.
Note
The precise way of doing this shown here is specific to Aldryn Django projects. For another service or a project not using Aldryn Django, the principle would be the same, but the details would be different.
Test the new configuration
You can test your logging configuration locally, and once you have done that, deploy the site on the cloud once more.
Now the logs emitted by your application will be sent to LogDNA, where you can manage them better.